Black Week 2021 - Advertising and Shopping in Smartphone Apps
By Isabelle Halscheid on Dec 15, 2021
The Corona pandemic continues to shape people’s everyday lives in 2021. We are continuing our article series on Christmas shopping behavior. Our analysis focuses on Black Week with Black Friday, in comparison to the previous weeks of November. The analysis is based on real in-app smartphone usage data from everyday life - not on questionnaires.
In-app shopping behavior of 488 smartphone owners was recorded and analyzed over a period from November 5 to November 29, 2021. Of these 488 participants, 176 used Facebook app and 158 Amazon shopping app. Subjects participated in the study in compliance with the GDPR.
Key-Takeaways
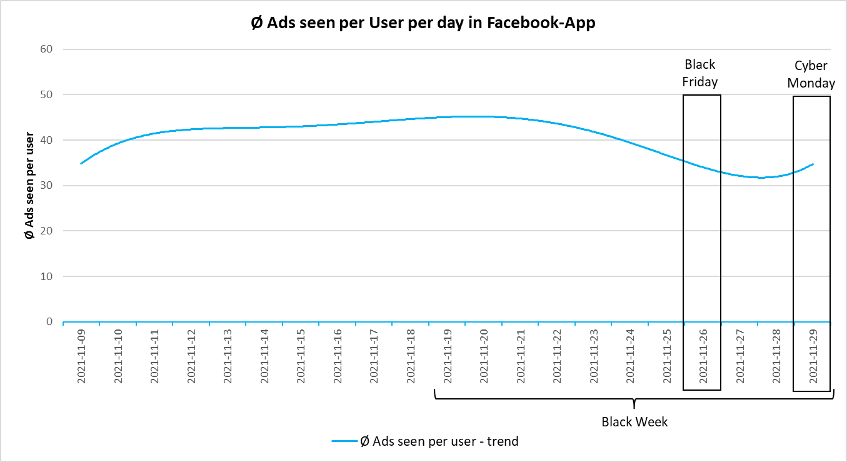
⚖️ Users see the same number of ads per day (approx. 41) in Facebook app during Black Week as in previous weeks.
💸 Amazon advertises the most, reaching 48% of our users during Black Week.
💡 During Black Week, more than twice as many products from the Kitchen, Household & Home category are clicked on in Amazon app. Electronic products are also viewed more frequently, while clothing and sports & leisure drop off significantly.
Advertising in Facebook-App

Overall, users do not see more ads in Facebook app than in previous months (an average of 41 ads per user per day). Facebook ensures that users are not burdened with significantly more ads during Black Week.
The top advertisers on Facebook during Black Week are Amazon, Disney and BestSecret. Amazon advertises the most, reaching nearly one in two Facebook users (about 48%) in the study with at least one ad through Facebook app. While Amazon reaches roughly the same number of users with its ads during Black Week and the previous week (08.-18.Nov 2021), Disney concentrates its advertising efforts on the previous week. Here, Disney places more than twice as many ads and reaches about 15% more Facebook users compared to Black Week (Reach Black Week= approx. 35%, Reach previous week= approx. 49%).
During Black Week, a total of more than 850 different ads were served with the keyword “Black Friday,” compared to just 200 during the previous week.
Over the entire survey period, discounts were heavily advertised to encourage users to buy. Particularly many companies advertise with Black Week “discounts” or Black Week “deals” during Black Week and the days before Black Friday.

Usage of shopping apps during Black Week

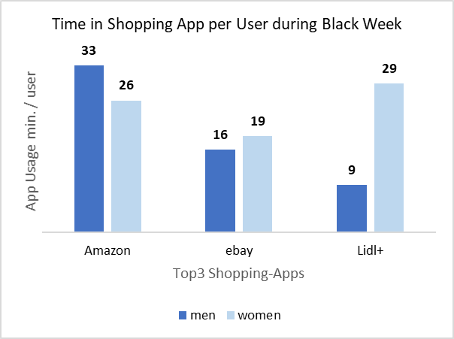
Amazon’s high advertising pressure is visible in the increased use of Amazon Shopping app during Black Week. It is the most-used shopping app, followed by Lidl+ app and ebay.
Amazon app is used slightly longer by men during Black Week, with an average of 33 minutes; the reverse is true for ebay. Lidl+ app, on the other hand, is used by women for significantly longer.
Shoppingverhalten in der Amazon-App

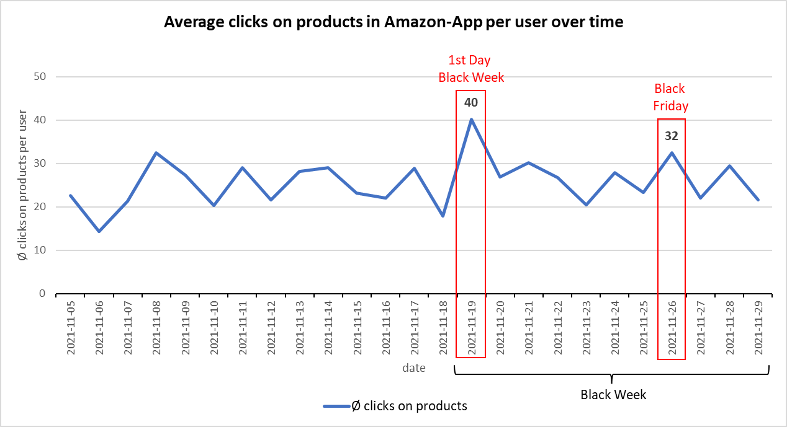
Over the course of November, more products are clicked in Amazon app on average.
With the start of Black Week on 19 November, users look at the most products in Amazon app (an average of 40 product views per user). On Black Friday, more products are clicked on in the Amazon app compared to the previous days of Black Week.

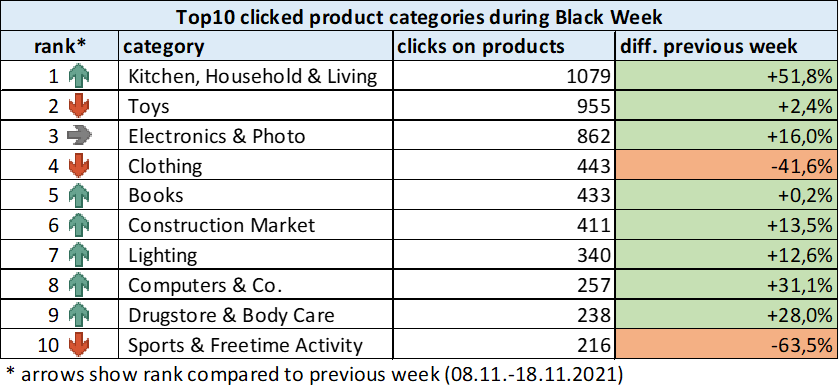
Most products are viewed in the Kitchen, Household & Home category. There is also an increase in searches for Toys, Electronics & Photo and Clothing.
Compared to the previous week, more than twice as many products from the Kitchen, Household & Living category are clicked on during Black Week. Products from the clothing and sports & leisure categories are viewed less and lose their spots ranking.
Amazon’s advertising pressure pays off: During Black Week, more purchases per user are made on average via the Amazon app.
We have refrained from making more detailed statements on Amazon shopping behavior due to the small sample size.
If you are interested in details and further information about our study results (e.g. Instagram advertising), please contact us.